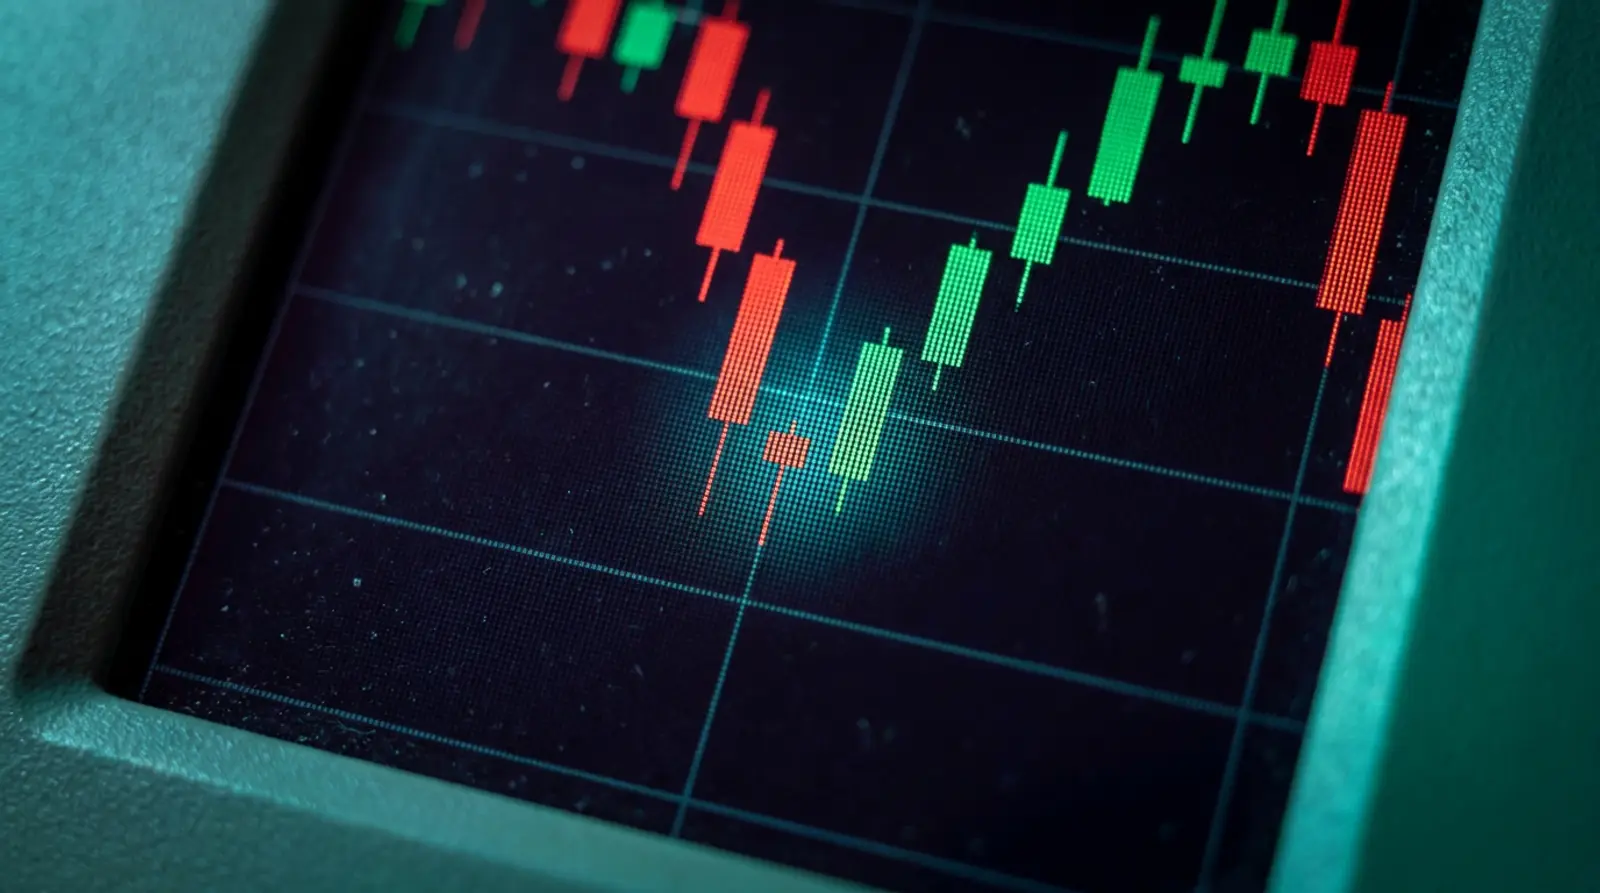
A candlestick chart is a basic tool that nearly every forex trader uses to read price, because a single candle tells you the open, the close, the high, the low, and the "mood" of the market in that period. If you can read candles, you see the battle between buyers and sellers much more clearly.
This article will introduce everything from the structure of a candle, how to tell bullish from bearish candles, all the way to common reversal patterns and continuation patterns, with a summary table for easy recall — and most importantly the "cautions" that candlestick patterns are not fixed signals and must always be read alongside context.
Note: This article is for educational purposes only and is not investment advice. Forex trading carries high risk and you can lose your entire deposit. Always study carefully and assess the risk yourself before going live.
What Is a Candlestick Chart and Why Traders Love It
A candlestick chart is a way of showing price movement as "candles," where each candle represents one time period, such as 1 minute, 1 hour, or 1 day, depending on the Time Frame you choose. The concept originated with Japanese rice traders hundreds of years ago and is still widely used today.
Candles are more popular than a plain line chart because a single candle conveys all of the open, close, high, and low, and also signals the "strength" of buyers and sellers through the color and shape of the candle. This lets you read market mood faster and spot recurring patterns that may inform your decisions.
Candle Structure: the Body and the Wick
A single candle consists of four price values, together called OHLC: the Open, High, Low, and Close. These four values are drawn as two main parts: the "Body" and the "Wick/shadow."
The Body is the thick rectangle between the open and close prices, showing how far the price ran from open to close. The Wick is the thin line extending from the Body to the high and low, showing how far the price reached before being pulled back.
Reading the ratio between Body and Wick matters greatly. A long body means one side has decisive strength, while a long wick indicates a price rejection occurred — for example, a long lower wick means the price was pushed down but buying strength pushed it back up.
- Open — the first price of that period
- High — the highest point the price reached in that period (the tip of the upper wick)
- Low — the lowest point the price reached in that period (the tip of the lower wick)
- Close — the last price of that period
- Body — the distance between Open and Close · Wick — the distance from the Body to the High/Low
Bullish vs Bearish Candles: How to Read Color and Direction
A candle's color tells you the price direction in that period instantly. Generally a bullish candle is green or white, meaning the close is higher than the open — buyers won that round. A bearish candle is usually red or black, meaning the close is lower than the open — sellers won. Colors can be changed in each platform's settings.
Beyond color, look at the "length" of the body too. A long, full green candle with almost no wick indicates very strong buying. Conversely, a candle with a small body but long wicks on both top and bottom signals market hesitation, with the two sides evenly matched and neither clearly in control.
Popular Reversal Candlestick Patterns
A reversal pattern is a candle shape that may signal the existing trend is about to change direction, such as from up to down or from down to up. These patterns are the most well-known and discussed among traders. The table below summarizes the popular ones for an overview.
| Pattern | Key feature | Commonly interpreted signal |
|---|---|---|
| Doji | Very small body, open and close nearly equal, wicks on both sides | Market hesitation, possibly a reversal or pause |
| Hammer | Small body on top, long lower wick, at the end of a downtrend | Buying pushed back, possible upward reversal |
| Shooting Star | Small body on the bottom, long upper wick, at the end of an uptrend | Selling pressed down, possible downward reversal |
| Bullish Engulfing | A large green candle fully engulfs the previous red candle | Buyers take over, possible upward reversal |
| Bearish Engulfing | A large red candle fully engulfs the previous green candle | Sellers take over, possible downward reversal |
| Pin Bar | A clear long wick on one side, small body | Price rejection, possible reversal in the wick's direction |
| Morning Star | Three candles: long red-small-long green, at the end of a downtrend | Upward reversal signal |
| Evening Star | Three candles: long green-small-long red, at the end of an uptrend | Downward reversal signal |
A Closer Look at Common Reversal Patterns
A Doji forms when the open and close are almost equal, so the body is nearly a line, reflecting buyers and sellers being very evenly matched. It is therefore often seen as a market "hesitation" point. If a Doji appears after a long, clear trend, it may warn that the trend is losing steam, but a single Doji alone does not confirm a reversal.
The Hammer and Pin Bar focus on the "long wick," which indicates price rejection. For example, a Hammer at the end of a downtrend has a long lower wick, meaning the price was hammered down but buying strength pushed it back up to close near the high, interpreted as buyers gaining power. Conversely, a Shooting Star at the end of an uptrend signals selling pressure entering.
Engulfing is a two-candle pattern where the second candle has a large body that "engulfs" the entire previous candle. A Bullish Engulfing (green engulfs red) is usually seen as an upward reversal signal, while a Bearish Engulfing (red engulfs green) is a downward reversal signal. The larger the engulfing candle and the closer it forms to a key support/resistance, the more weight it carries.
Continuation Patterns: the Trend Keeps Going
Besides reversal patterns, there are candlestick patterns that suggest the existing trend is likely to "continue" after a brief pause, called continuation patterns, which help traders distinguish a normal pullback from a genuine reversal.
Common examples include Rising/Falling Three Methods — a large candle with the trend, followed by a few small counter-trend candles, then closing with another large candle in the original direction — or Marubozu, a long full candle with no wick showing decisive one-sided strength, indicating the trend still has momentum.
- Rising Three Methods — a brief pause in an uptrend, then continuing up
- Falling Three Methods — a brief pause in a downtrend, then continuing down
- Marubozu — a long candle with no wick, showing decisive one-sided strength; the trend is still strong
Caution: Candles Are Not Fixed Signals
A common beginner mistake is seeing a candlestick pattern and rushing into an order immediately, when a candlestick pattern is only a "probability," not a trade command that guarantees results. The same pattern in different contexts can produce completely different outcomes, so you must always consider the surrounding factors.
Things to consider alongside it include the main trend, key support/resistance, the Time Frame used, trading volume, and economic news. A candlestick pattern that forms at support/resistance and aligns with the larger trend is usually more reliable than one that appears floating in the middle of the chart.
This article is for educational purposes only and is not investment advice. Forex trading carries high risk and you can lose your deposit. No chart pattern or strategy guarantees profit. You should practice on a demo account, manage risk with a Stop Loss, and trade only with money you can afford to lose.
From Reading Charts to Automation (EA) and a VPS
Once you can read candles and patterns fluently, many people want to turn their chart-reading rules into an automated system. That is the origin of the EA (Expert Advisor), a program that sets conditions such as "when a Bullish Engulfing forms at support, open an order," and lets the system work for you with discipline, without watching the screen all the time.
But an EA only works when the trading program (MT4/MT5) is open and connected to the internet at all times. If you run it on a home PC, a single power cut or dropped connection stops the EA and you may miss key moments. EA traders therefore favor a Forex VPS that is on 24 hours a day in a data center, so the system runs continuously and stably.
Want Your Chart-Reading Rules Running 24/7?
Once you turn candlestick signals into an EA, you need a Forex VPS to run it without interruption — Plusweb Forex VPS supports MT4/MT5 · Windows Server · low latency · high uptime · from ฿250/mo
Frequently Asked Questions
How do you read a candlestick chart simply?
Look at three main things: the candle color (green/white = close above open, red/black = close below open), the length of the body which shows the strength of buyers/sellers, and the wick which shows the high/low and price rejection. Reading these three parts starts to reveal the market picture in that period.
What are the reversal candlestick patterns?
Popular patterns include Doji (market hesitation), Hammer and Pin Bar (long wick rejecting price), Bullish/Bearish Engulfing (a large candle engulfing the previous one), and Morning/Evening Star (three candles). All are only probabilities and should be used alongside support/resistance and the main trend, not as fixed signals.
How accurate are candlestick patterns?
Candlestick patterns are not 100% accurate; they only indicate the probability of price behavior. Their reliability depends on context, such as forming at key support/resistance, aligning with the larger trend, and having a confirmation candle. Use them alongside other tools, not to decide from candles alone.
What should beginners practice reading first with candles?
Start by understanding the OHLC structure (open/high/low/close) and being able to tell bullish from bearish candles first. Then memorize 3-4 basic reversal patterns and practice observing them on a demo account (simulated money) to see how the patterns work in different contexts without risking real money.
Can I turn chart reading into an automated EA?
Yes. Chart-reading rules can be written as an EA (Expert Advisor) to open/close orders automatically based on set conditions, but the EA must run on MT4/MT5 that is open at all times. Most traders therefore use a Forex VPS to keep the system running 24/7 without leaving their own computer on.
GUIDES
Related articles
Keep reading on similar topics

How to Start Trading Forex: A Step-by-Step Guide for Beginners
A step-by-step Forex trading guide for beginners — how Forex works and how to start the safe way, from learning the basics and opening a demo account to building a plan, managing your money, and going live. Includes risk management, the mistakes new traders make, and the risks you must understand first.
Read more
What Is a Forex Indicator? The Most Popular Ones Explained
Understand Forex indicators from scratch — what an indicator is and what it does, the two main types (Trend such as MA/MACD, and Momentum/Oscillator such as RSI/Stochastic), how to combine them, the limitations to know (lagging, false signals), and how they relate to EAs.
Read more
What Is Forex? How to Start Trading — Beginner's Guide 2026
A complete beginner's roundup — what forex is, what forex trading involves, how the foreign exchange market works, plus the basic terms (currency pairs, pip, lot, leverage, spread), how to start safely, and the risks you must know before going live.
Read more