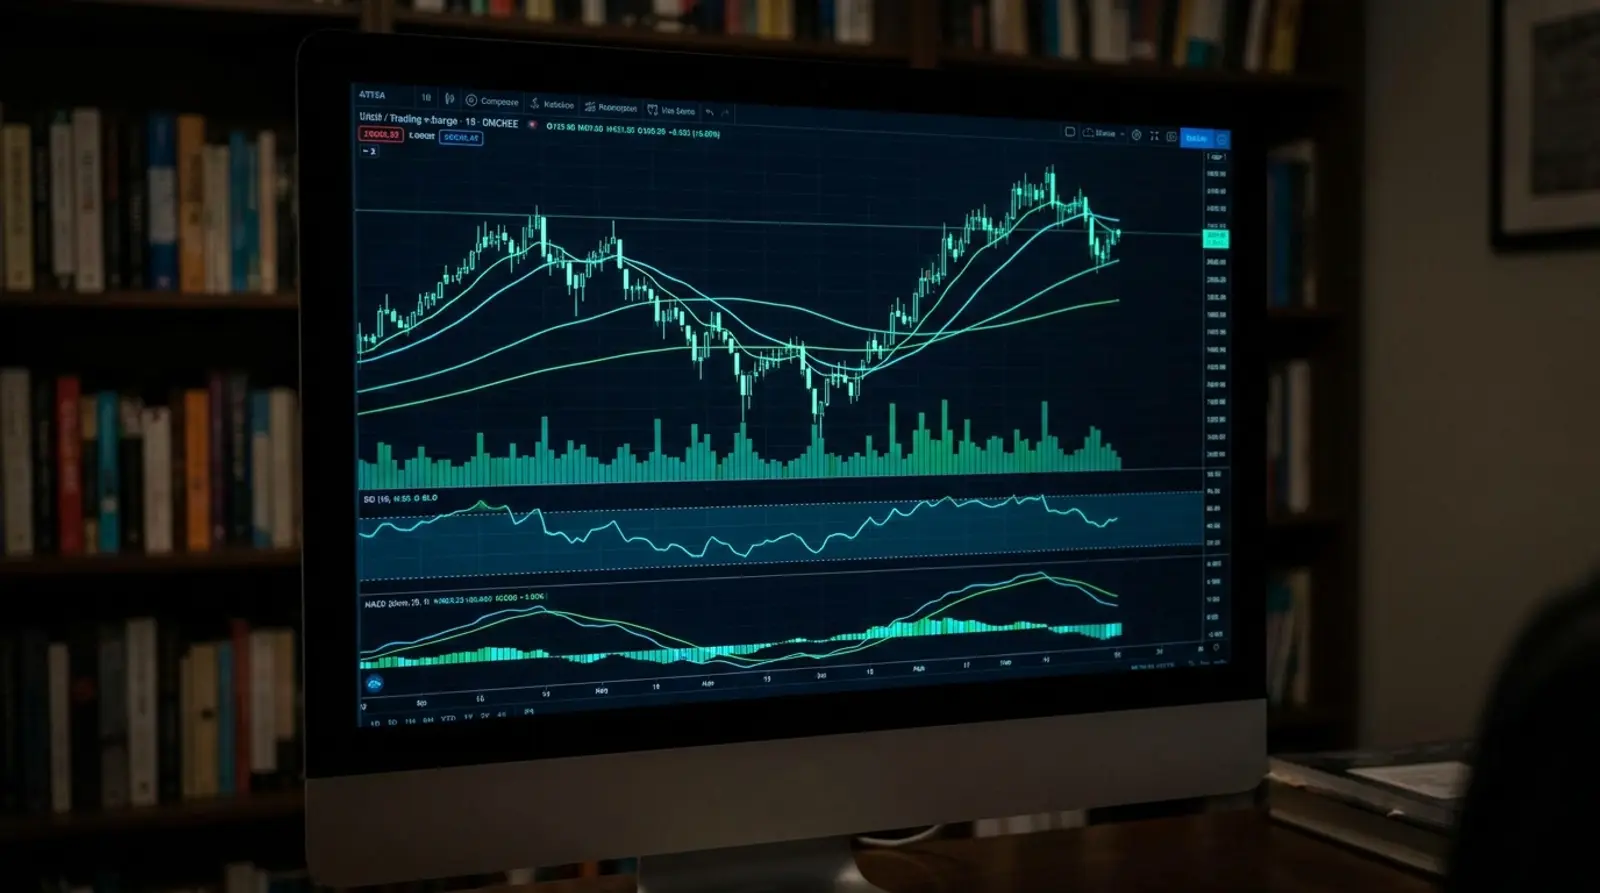
If you open a Forex chart and see it filled with strange lines and graphs, most of those are indicators — analysis tools that almost every trader uses. But what exactly is an indicator, how many types are there, and how should you use them to actually benefit? This article explains it all from the ground up.
We will cover what indicators are calculated from, the two big groups they fall into (Trend and Momentum/Oscillator), popular examples like MA, MACD, RSI, and Stochastic in a comparison table, how to combine indicators so they reinforce each other, the limitations you must know (they are not a magic button), and finally how they relate to EAs that use indicators to make decisions automatically.
Note: this article is for educational purposes only and is not investment advice. Forex trading carries high risk and you can lose your deposit. No indicator guarantees profit. Always study and assess the risk yourself before trading for real.
What Is a Forex Indicator?
An indicator is a technical tool calculated from past price and/or volume data, then displayed as lines, graphs, or numeric values to help traders see things that are hard to spot with the naked eye — such as trend direction, momentum, or overbought/oversold conditions.
Put simply, an indicator takes existing price numbers and "transforms" them with a mathematical formula to summarize the data into something easier to read. It does not predict the future directly, but it helps organize past and present data so you can make decisions more systematically. This point is crucial because many people mistakenly think an indicator is a magic crystal ball.
Most indicators display in one of two ways: overlaid directly on the price chart (an overlay, such as a moving average line) or in a separate window below the chart (an oscillator, such as RSI). We will get into the details in the next section.
The 2 Main Types of Indicators: Trend vs Momentum
There are dozens of indicators, but if you understand the split into two big groups you can choose the right one for the job. The first group is Trend indicators, which tell you the "direction" and strength of a trend. The second is Momentum/Oscillator indicators, which tell you "swing force" and overbought/oversold conditions.
Trend indicators suit markets with a clear trend, helping you trade in the main direction — for example, the Moving Average (MA), which averages price, and the MACD, which looks at the relationship between two moving averages. Oscillators suit range-bound (sideways) markets and help catch reversals — for example, RSI and Stochastic, which tell you whether price has swung to an extreme yet.
| Type | What it tells you | Popular examples | Best for |
|---|---|---|---|
| Trend indicator | Direction and strength of the trend | MA, EMA, MACD, ADX | Markets with a clear trend |
| Momentum / Oscillator | Swing force, overbought/oversold | RSI, Stochastic, CCI | Range-bound (sideways) markets |
Trend Indicators: MA and MACD
The Moving Average (MA) is the most basic indicator, calculated from the average of past prices over a set number of candles — for example, MA 50 is the average of the last 50 candles. It filters out the "noise" of price so the main direction shows more clearly. Traders often watch whether price is above or below the MA, or watch two MAs crossing, to gauge the trend.
The MACD (Moving Average Convergence Divergence) builds on the MA idea by looking at the relationship between two moving averages and displaying it as a histogram, telling you both direction and momentum in one tool. When the MACD lines cross or the histogram changes direction, it is often used as a supporting signal. This is only decision-support information, not a buy/sell signal that guarantees results.
Momentum / Oscillator: RSI and Stochastic
RSI (Relative Strength Index) is a popular oscillator that measures the strength and speed of price change, shown on a 0–100 scale. Generally, a value above 70 is seen as overbought and below 30 as oversold, which can be moments where price reverses. But in a strongly trending market, RSI can stay pinned in an extreme zone for a long time.
The Stochastic Oscillator works similarly, comparing the latest closing price to the high–low range of the recent period. It is used to catch overbought/oversold conditions and to watch the %K and %D lines crossing for reversal timing. Both oscillators suit sideways markets better and are often used to confirm signals from a trend indicator.
There is also the concept of Market Sentiment — the mood of the market — which tries to measure whether most traders are buying or selling. Some platforms show this as a ratio, but it is only a supporting view and should not be used to decide alone.
How to Combine Indicators So They Reinforce Each Other
Experienced traders rarely use a single indicator; they pair them so they complement each other. The idea is to pick from different groups to view the market from different angles — for example, use a trend indicator to set the main direction first, then use an oscillator to find an entry that aligns with that direction. This filters out false signals to a degree.
A common example is using an MA to confirm an uptrend, then waiting for RSI to dip into the oversold zone before considering a buy in the trend direction. This makes your entries more reasoned than using one tool alone. However, be careful not to add too many indicators, or your chart gets cluttered and the signals contradict each other until you cannot decide.
- Pair across groups — Trend (direction) + Oscillator (entry timing).
- Let indicators confirm one another to reduce entries on false signals.
- Do not add too many indicators, cluttering the chart with conflicting signals.
- Always use them alongside price action and support/resistance.
Indicators Are Not a Magic Button: Lagging and False Signals
A key limitation beginners must understand is that most indicators are "lagging" — they trail price because they are calculated from past data, so they often signal later than the actual move. This is especially true of moving averages that use a lot of historical data: the better they filter noise, the slower they respond. It is an unavoidable trade-off.
Indicators also give "false signals" often, especially in volatile or directionless markets — for example, RSI touching overbought while price keeps rising, or MAs crossing then price reversing. So you should not trust an indicator signal alone without considering the context.
This article is for educational purposes only and is not investment advice. Forex trading carries high risk and you can lose your deposit. No indicator or setting guarantees profit. Test on a demo account, manage risk with a Stop Loss, and trade only with money you can afford to lose.
How Indicators Relate to EAs, and Why They Run on a VPS
The key connection is that EAs (Expert Advisors), or automated trading systems, mostly "use indicators as their decision conditions" — for example, a rule like "when the MAs cross and RSI is below 30, open a buy order." The EA calculates these indicator values in real time and places orders for you with discipline, without emotion, letting indicator-based strategies run consistently.
But for an EA to calculate indicators and open/close orders continuously, the MT4/MT5 platform must be open and connected to the internet at all times. Run it on your home PC and a power cut, dropped connection, or restart stops the EA and can make it miss the important signals you set up. That is why EA traders choose a Forex VPS.
A Forex VPS is a virtual server that stays on 24 hours a day in a data center, with backup power and internet and low latency, so your EA can calculate indicators and send orders continuously and stably without leaving your home computer on — and you can remote in to manage it from anywhere.
Keep Your Indicator-Based EA Running 24 Hours a Day
When your system relies on indicators to decide, it needs a Forex VPS that never skips a beat — a Plusweb Forex VPS supports MT4/MT5 · Windows Server · low latency · high uptime · from ฿250/month.
Frequently Asked Questions
What is an indicator, in simple terms?
An indicator is a tool calculated from past price and volume data, then shown as lines or numeric values to help traders see trend, momentum, or overbought/oversold conditions more easily. It helps organize data — it does not predict the future and does not guarantee results.
How many types of Forex indicators are there?
There are two main groups: Trend indicators, which show the direction and strength of a trend (e.g. MA, MACD), and Momentum/Oscillator indicators, which show swing force and overbought/oversold conditions (e.g. RSI, Stochastic). Trend indicators suit trending markets, while oscillators suit range-bound markets.
Which indicator is best for beginners?
There is no single best one — it depends on your strategy and market conditions. But beginners often start with the Moving Average (MA) because it is easy to understand and shows the trend clearly, then add RSI for timing. What matters is using them with understanding, testing on demo, and not relying on any single indicator alone.
Will using indicators guarantee a profit?
No. Indicators are only analysis helpers with limitations, such as lagging price and giving frequent false signals. Forex trading carries high risk and you can lose money. No indicator or system guarantees profit, so always use them alongside risk management.
How do EAs use indicators, and why do they need a VPS?
Most EAs use indicator values as conditions to open and close orders automatically — for example, when the MAs cross and RSI reaches a set level. But an EA must run on MT4/MT5 that stays on at all times, so traders use a Forex VPS that is on 24/7 with low latency, allowing the EA to calculate indicators and send orders continuously without leaving a home computer on.
GUIDES
Related articles
Keep reading on similar topics
How to Read Candlestick Charts + Popular Reversal Patterns
Learn to read candlestick charts from zero — candle structure (open/high/low/close and wicks), bullish and bearish candles, popular reversal patterns (Doji, Hammer, Engulfing, Pin Bar, Morning/Evening Star), and the cautions to always read alongside context.
Read more
What Is a Forex EA? How It Works, Is It Safe, and How to Run It Without Drops
A complete guide to the Forex EA (Expert Advisor) — what it is, how it works on MT4/MT5, how many types there are, whether it's safe, plus the red flags of dream-selling EAs and why an EA needs to run 24/7 on a VPS.
Read more
How to Start Trading Forex: A Step-by-Step Guide for Beginners
A step-by-step Forex trading guide for beginners — how Forex works and how to start the safe way, from learning the basics and opening a demo account to building a plan, managing your money, and going live. Includes risk management, the mistakes new traders make, and the risks you must understand first.
Read more